Daycare Ratios and Capacity 2026: The Real Enrollment Math
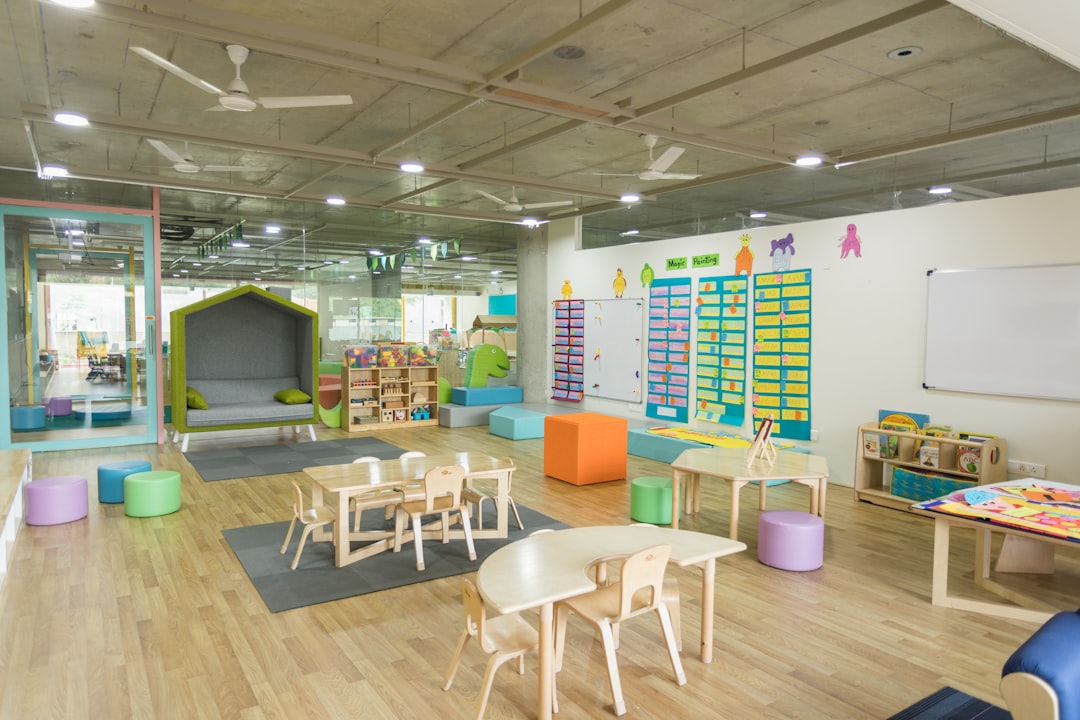
Most people opening a daycare think the size of their revenue is a marketing question — fill the rooms and the money follows. It isn’t. Your maximum revenue is set the day you sign the lease, by two numbers you don’t control: your state’s child-to-staff ratios and the usable square footage of your rooms. Marketing only decides how fast you reach a ceiling that’s already fixed in the licensing code.
That’s the part new owners miss. You can’t “sell your way” past a ratio. If your state says one adult per four infants, a twelve-baby room needs three teachers whether you’re 60% full or 100% full — and the room can never hold a thirteenth baby without a fourth teacher and more square footage. This guide is the honest capacity math: how ratios and floor space cap your enrollment, and how that ceiling decides whether the whole business is profitable.
Note: Child-to-staff ratios, group-size limits, and square-footage minimums are set by each state’s licensing agency and vary substantially. Some states also relax ratios for mixed-age rooms or tighten them for infants. The figures below are common 2026 U.S. patterns — confirm your own state’s licensed capacity before you model anything.
Why Ratios Are the Whole Game
In most businesses one more customer is nearly free profit. Daycare doesn’t work that way, because staff cost is legally tied to enrollment. State ratios dictate the minimum number of adults per child by age, and you cannot count a child you can’t legally supervise.
This creates a stair-step cost structure. Add children one at a time and nothing happens to your staffing — until you cross a ratio line, and suddenly you owe a whole new salary. The economics of a daycare live entirely in how cleanly your enrollment fills each ratio “bucket” without stranding a half-empty room that still needs a full-time teacher.
Typical 2026 Ratios by Age
Ratios get looser as children get older, because one adult can safely supervise more of them. Common patterns:
| Age Group | Typical Ratio | Typical Max Group Size |
|---|---|---|
| Infant (6wk–18mo) | ~1:3 to 1:4 | 8–12 |
| Toddler (18mo–3yr) | ~1:4 to 1:6 | 10–14 |
| Preschool (3–5yr) | ~1:10 to 1:12 | 18–24 |
| School-age (5yr+) | ~1:12 to 1:15 | 24–30 |
Two rules hide inside this table. First, infants are the most expensive child you can enroll — the tightest ratio means the most staff hours per baby. Second, most states cap not just the ratio but the total group size per room, so even a big room can’t be a single mega-class. Both limits shape your floor plan.
The Square-Footage Ceiling
Ratios cap children per adult. Square footage caps children per room. Most states require roughly 35 sq ft of usable indoor space per child and 75 sq ft of outdoor space per child — and “usable” excludes hallways, bathrooms, cubbies, kitchen, and office.
Do the arithmetic before you love a building. A 2,000 sq ft space sounds generous, but after you subtract circulation and support areas you might have 1,400 usable sq ft — which at 35 sq ft caps you at 40 children total, no matter how many teachers you hire. The lease you sign is a hard cap on enrollment, and you cannot renegotiate it with a better ad campaign.
Putting It Together: The Enrollment Math
Real licensed capacity is the smaller of two numbers, computed room by room:
- Ratio/group-size cap — how many children the age-appropriate ratio and group limit allow.
- Square-footage cap — usable room area divided by the per-child minimum.
Take the lower number for each room, then sum across rooms. That total — not your optimism — is the ceiling on how much tuition you can ever collect.
Worked example, a small center laid out as three rooms:
| Room | Ages | Ratio/Group Cap | Usable Sq Ft ÷ 35 | Licensed Capacity |
|---|---|---|---|---|
| Room A | Infant | 8 (1:4, two teachers) | 350 → 10 | 8 |
| Room B | Toddler | 12 (1:6, two teachers) | 420 → 12 | 12 |
| Room C | Preschool | 16 (1:10, two teachers) | 560 → 16 | 16 |
| Total | 36 |
That’s why a 36-child model recurs in daycare planning — it’s a clean fit of three age rooms into common ratio and space limits. In that model, tuition lands in the $1,000–$1,300/month range per child (infants at the top, preschoolers at the bottom, mirroring the ratio cost). Multiply 36 children by that band and you have the revenue ceiling of the entire business, fixed by the floor plan.
How Ratios Cap Revenue — and Margin
Here’s the trap that sinks new centers. Rent and core staff are fixed the moment you open; they don’t shrink because a room is half full. So the ratio ceiling sets your revenue, but the ramp to that ceiling sets whether you survive.
- A center built for 36 children but running at 60% enrollment still pays full rent and can’t legally thin its infant-room staffing below ratio — it just collects less tuition.
- New daycares don’t open full. They ramp to capacity over roughly 10 to 12 months, and every month spent below break-even burns startup cash.
- Even at capacity, daycare is a thin-margin business — a healthy small center or home program often runs a 5–10% operating margin. There’s no slack to absorb a chronically empty room.
The lesson: your ratio math sets the prize, and your ramp speed decides whether you reach it before the cash runs out. Pre-enrollment and a waitlist aren’t marketing niceties — they’re how you compress the money-losing part of the ramp.
The Mixed-Age Room Temptation
New owners often try to game ratios by mixing ages in one room. Be careful: most states apply the ratio of the youngest child present. Put one infant in a toddler room and the whole room may snap to the infant ratio, forcing more staff and lowering your effective capacity. Mixed-age rooms can help a tiny home daycare, but in a center they usually cost capacity rather than add it. Model it both ways before you commit a floor plan.
Common Capacity Mistakes
Four errors that quietly cap a daycare below its potential:
- Signing a lease before computing usable square footage. The gross number is a trap; only usable space counts toward capacity.
- Staffing to the ratio, then forgetting group-size caps. A room can be within ratio and still illegal if it exceeds the maximum group size.
- Pricing every age the same. Flat tuition guarantees you lose money on the ratio-heavy infant room and leave money on the table in preschool.
- Modeling revenue at 100% from day one. Capacity is the ceiling, not the opening number. Plan for the 10–12 month ramp or you’ll misjudge Year 1 cash.
FAQ
Are daycare ratios the same in every state? No. Ratios, group-size caps, and square-footage minimums are set by each state’s licensing agency and vary widely. The numbers here are common 2026 patterns — always confirm your own state’s licensed capacity.
Why do infants cost so much more to care for? Because the infant ratio is the tightest — often one adult per three or four babies. More staff hours per child means the highest cost, which is why infant tuition sits at the top of the price band.
What counts as “usable” square footage? Generally the open program space children actually use. Hallways, bathrooms, cubby areas, kitchen, office, and storage are typically excluded, so your usable figure is well below the building’s gross square footage.
Can I raise capacity by hiring more teachers? Only up to the square-footage limit. Once a room hits its space cap, more staff can’t add children. Ratios and floor space both have to allow the next child.
What capacity should a new center plan around? Model your licensed ceiling, then plan finances around a realistic 10–12 month ramp to it — stress-testing cash flow at roughly 60–70% enrollment, not at a full house.
The Full Playbook
This post is the capacity math. The full daycare toolkit — a 36-child enrollment model, tuition tier calculator, state-by-state licensing matrix, 12-month P&L, and the 7-chapter D.A.Y.C.A.R.E. framework (with a 3-year forecast reaching $381K–$531K at the top of the range) — is inside the daycare business plan and toolkit on Etsy.