Bakery Product Mix 2026: Which Items Actually Make Money
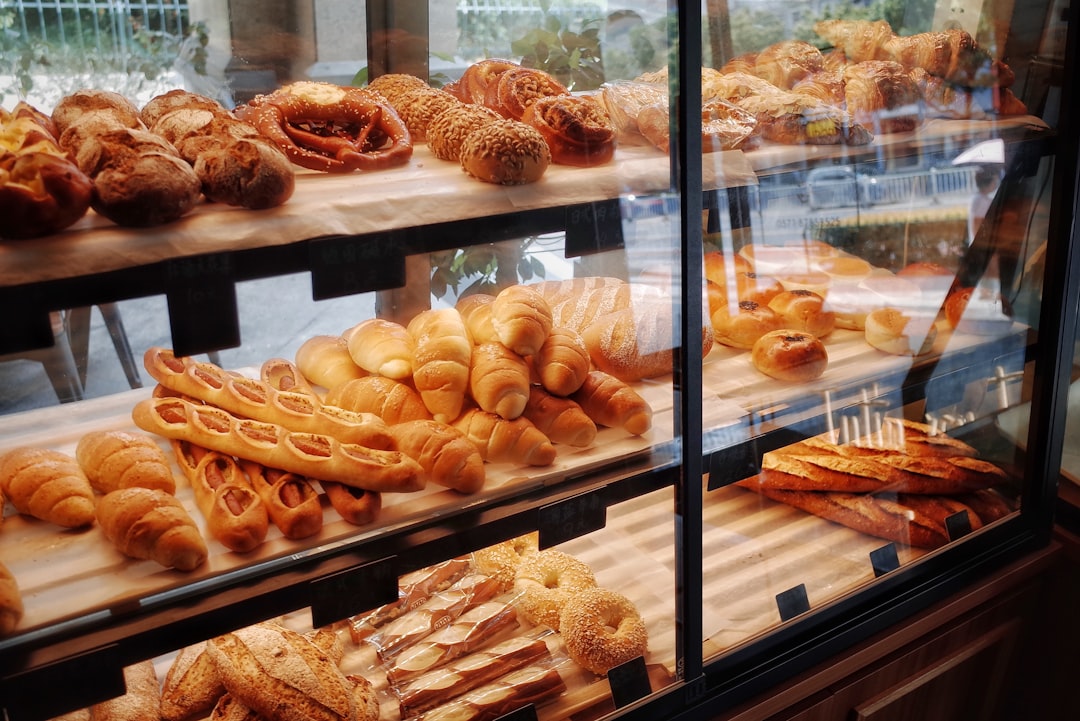
Ask a struggling bakery owner which of their products makes the most money and you will usually get the wrong answer. They name the item that sells the most units — not the item that drops the most dollars to the bottom line. Those are almost never the same product. A bakery can be busy from open to close, sell out of everything, and still bleed cash, because the busiest SKUs are the ones with the thinnest contribution margin and the highest labor per unit.
Product mix is the quiet lever that separates a bakery that survives Year 2 from one that closes. It is not about baking better; it is about knowing, per item, how many real dollars each one contributes after ingredients, labor, and packaging — and then deliberately steering the case toward the winners. This guide is the 2026 framework for finding out which items actually make money and pruning the rest.
Note: Contribution-margin figures and category benchmarks below are 2026 U.S. patterns. Your real numbers depend on supplier pricing, region, staff wage, and equipment efficiency. Use the method, plug in your own per-item costs, and rerun it for every menu change.
Volume Is Not Margin
The single most expensive misunderstanding in a bakery is treating a best-seller as a best-earner. A $3 muffin that sells 120 units a day feels like the anchor of the business. But if that muffin carries $1.10 of ingredients, $0.90 of labor, and $0.30 of packaging, its contribution margin is $0.70 — and 120 of them contribute $84 a day. A $6 croissant that sells 40 units a day at a $2.30 contribution margin contributes $92 a day off a third of the volume, a third of the oven space, and a third of the counter congestion.
The metric that matters is contribution margin per item — retail price minus the variable costs that move with each unit (ingredients + direct labor + packaging + waste). Fixed overhead like rent does not belong in this number; that gets covered by total contribution across the whole mix. Rank every SKU by contribution margin and by daily units, and the real shape of your business appears.
The Per-Item Contribution Margin Calc
For each SKU, run the same short calc:
Contribution margin = Retail price − (ingredients + direct labor + packaging + waste allowance)
A worked comparison across a typical 2026 retail bakery case:
| Item | Retail | Ingredients | Labor | Packaging | Waste | Contribution/unit | Daily units | Daily contribution |
|---|---|---|---|---|---|---|---|---|
| Drip coffee (12oz) | $3.25 | $0.35 | $0.15 | $0.12 | $0.05 | $2.58 | 90 | $232 |
| Butter croissant | $5.25 | $0.76 | $1.85 | $0.35 | $0.35 | $1.94 | 40 | $78 |
| Cinnamon roll | $4.75 | $0.70 | $1.20 | $0.30 | $0.28 | $2.27 | 55 | $125 |
| Blueberry muffin | $3.50 | $0.85 | $0.55 | $0.28 | $0.22 | $1.60 | 70 | $112 |
| Sourdough loaf | $8.00 | $1.10 | $2.10 | $0.20 | $0.40 | $4.20 | 25 | $105 |
| Sugar cookie (single) | $2.00 | $0.32 | $0.70 | $0.18 | $0.14 | $0.66 | 45 | $30 |
Two things jump out. Coffee — if you run a coffee program — is almost always the highest-margin line in the building, which is why so many strong bakeries anchor the model on a coffee-plus-pastry pairing. And the sugar cookie, despite decent volume, contributes almost nothing per day; it exists mostly to fill the case and add labor.
The 80/20 of a Bakery Menu
Run this analysis across a full menu and the Pareto pattern shows up almost every time: roughly 20% of SKUs generate 70–80% of total daily contribution. A 24-item menu typically has 5–6 items doing the real financial work, 8–10 items pulling their weight, and 6–8 items that quietly drain labor and ingredient budget for a rounding error of contribution.
This is not an argument to cut the menu to six items. Variety drives foot traffic, and some low-contribution items are strategic — they photograph well, they bring a specific customer in, or they complete a “grab a dozen” order. The point is to know which is which, so the decisions are deliberate instead of sentimental.
The Four Menu Roles
Sort every SKU into one of four roles using contribution margin (high/low) against daily volume (high/low):
| High volume | Low volume | |
|---|---|---|
| High contribution | Anchors — protect, keep in stock, front of case | Sleepers — high margin but under-sold; add visibility and photograph for social |
| Low contribution | Traffic pullers — keep only if they bring customers who buy anchors too; tighten portion + waste | Dead weight — kill or radically reprice; reclaim the oven and labor time |
- Anchors are the business. Never let them run out mid-morning; a sold-out croissant at 9:30 is lost contribution you cannot recover.
- Sleepers are the fastest win — the margin is already good, you just need people to see them. Reposition to eye level, bundle into pickup boxes, feature in one photo a week.
- Traffic pullers earn their place only if the customer who comes for the cheap cookie also buys a $5 coffee. Track the basket, not the item.
- Dead weight is where you reclaim capacity. Every dead-weight SKU you cut frees oven cycles and labor minutes that anchors can use.
How to Prune the Losers
Pruning a menu is not a one-time purge. The disciplined version:
- Cost every SKU first. You cannot prune what you have not measured. Build the contribution calc above for all items before cutting a single one.
- Watch the basket, not the item. Before killing a low-contribution SKU, check whether the customers who buy it also buy anchors. If the cookie is the reason a parent brings three kids who each get a $4 hot chocolate, the cookie stays.
- Cut the bottom 10–15% by contribution — quietly. Rotate them off the menu without announcement. Most disappearances go unnoticed. If three regulars ask, you learned something; bring it back seasonally.
- Reclaim the freed capacity for anchors and sleepers. The goal of cutting dead weight is not a shorter shift — it is redeploying those oven cycles and labor minutes to the items that actually contribute.
- Cap the permanent menu; rotate the rest. Keep the permanent case to 20 SKUs or fewer in Year 1, and run seasonal specials on top. This keeps ingredient inventory tight, waste low, and the analysis manageable.
The bakeries that quietly waste the most money are the ones that only add SKUs — every new idea becomes a permanent case item, ingredient inventory balloons, waste climbs, and the anchors get crowded out by novelties nobody costed.
What Healthy Category Contribution Looks Like in 2026
Stabilized gross margins by category, as a sanity check against your own numbers:
| Category | Healthy gross margin |
|---|---|
| Drip coffee + espresso | 70–85% |
| Cakes + custom orders | 50–65% |
| Sandwiches + savory | 45–60% |
| Croissant + viennoiserie | 32–42% |
| Loaf breads (high labor) | 26–34% |
| Wholesale (bulk) | 25–35% |
A balanced retail bakery with a coffee program typically lands at a blended 38–48% gross margin. If your blended margin sits below 35%, the product mix is almost always the culprit: too much revenue riding on high-labor, low-contribution items and not enough on the anchors and the coffee line.
Common Product-Mix Mistakes
- Judging items by units sold instead of dollars contributed. The busiest SKU is frequently the least profitable per unit.
- Never costing laminated pastries against muffins. A croissant carries roughly 2–3× the labor of a muffin; pricing and mixing them as if they were equal quietly loses money on the prestige items.
- Letting the menu only grow. Every permanent add dilutes focus, inflates ingredient inventory, and raises waste.
- Cutting a low-contribution item that anchors the basket. Some cheap items exist to pull in high-spend customers. Check the basket before you cut.
- Not rerunning the numbers after a price change. Ingredient inflation of 4–7% a year silently converts an anchor into dead weight if you never recheck.
FAQ
What is contribution margin for a bakery item? Retail price minus the variable costs that move with each unit — ingredients, direct labor, packaging, and a waste allowance. It excludes fixed overhead like rent, which is covered by total contribution across the whole menu.
Which bakery items usually make the most money? When a coffee program is present, drip coffee and espresso almost always contribute the most per unit. Among baked goods, cakes and custom orders carry the highest gross margin, while high-labor items like croissants and loaf breads need careful pricing to stay profitable.
How many items should a bakery menu have? Keep the permanent case to 20 SKUs or fewer in Year 1 and rotate seasonal specials on top. Tight menus mean lower ingredient waste, simpler prep, and easier costing.
How do I know which items to cut? Cost every SKU, rank by daily contribution, and cut the bottom 10–15% — but first check whether those items anchor a larger basket. Kill true dead weight quietly and reclaim the freed oven and labor capacity for your anchors.
Should I match my product mix to competitors? No. Their labor model and cost structure are not yours. Build your mix from your own contribution numbers and your own customer basket data, not from what the bakery down the street stocks.
The Full Playbook
This post is the product-mix framework. The full system — an Excel costing calculator, a 12-month P&L, a menu engineering matrix, a per-item costing tool, and the 24 printable decision tools every bakery needs — is inside the bakery business plan and toolkit on Etsy. A 138-page lender-ready plan plus 24 printable tools, built for bakers who want to steer the case by the numbers, not the gut.
#Bakery #Product Mix #Contribution Margin #Menu Engineering #Small Business